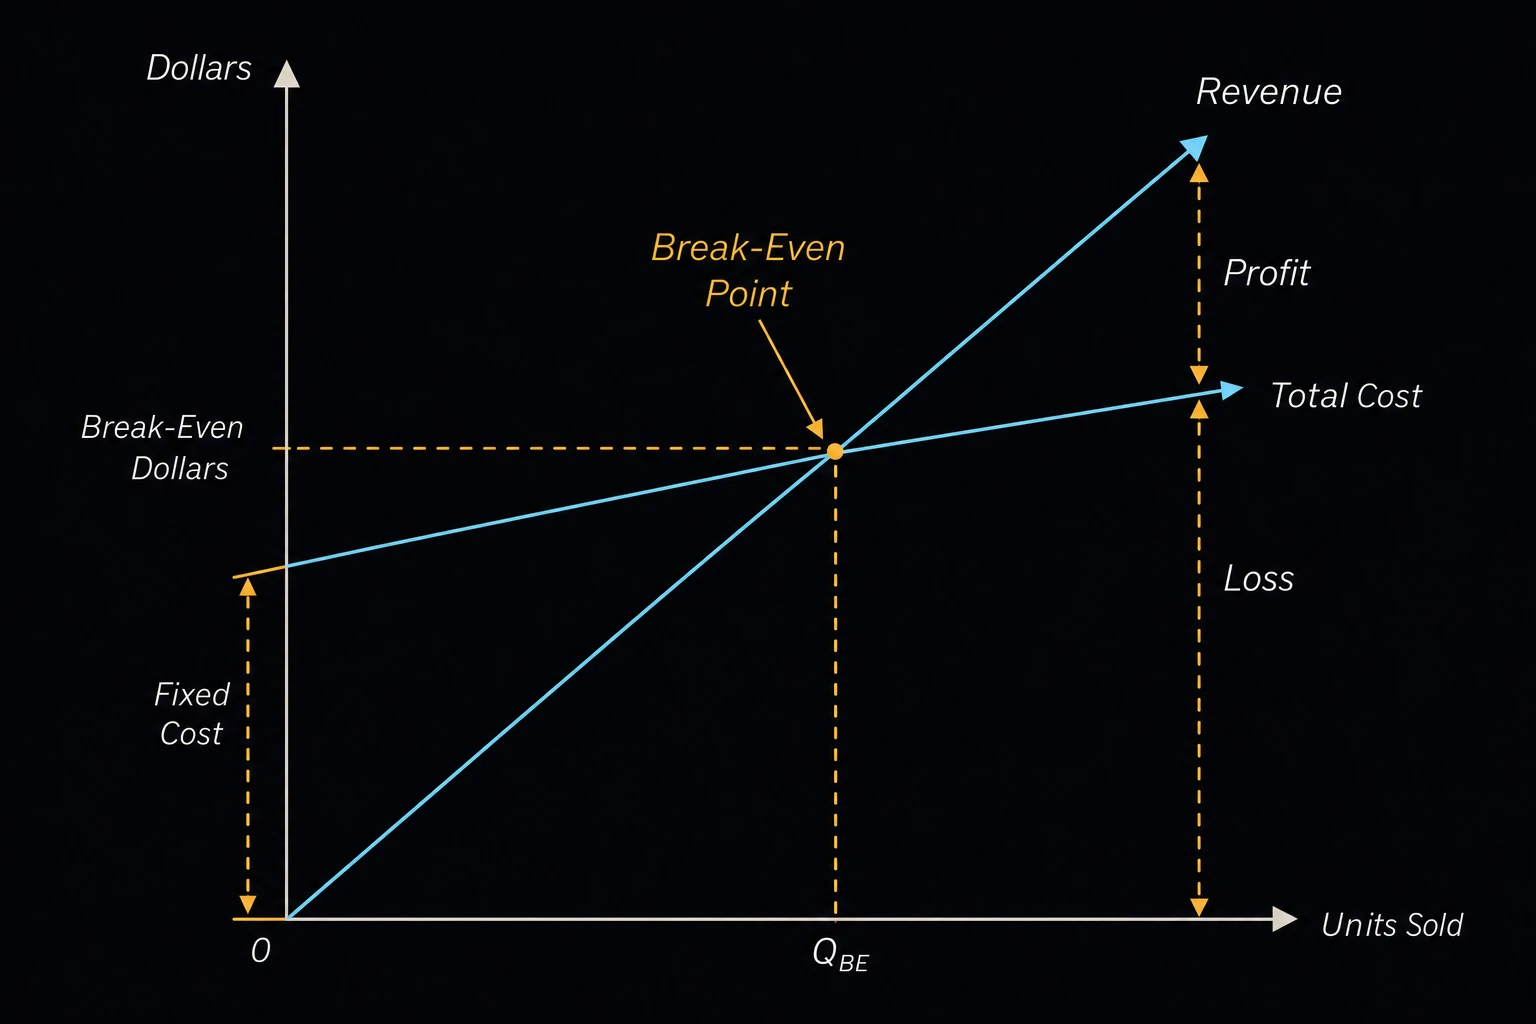
Break-Even Analysis
Finds how many units a product must sell to cover its fixed costs, and the sales revenue at that point. It also gives the volume for a profit target and, for a sales forecast you enter, the profit, the margin of safety and the degree of operating leverage. Engineers, plant managers and estimators use it to test a price, judge a new product line or compare a make-or-buy choice.
The break-even equations
CM = p − v QBE = F / CM RBE = F / (CM/p)
F is the total fixed cost for the period, p the selling price per unit and v the variable cost per unit. CM is the contribution margin, what each unit sold adds toward the fixed cost and then profit, and CM/p is the contribution margin ratio. QBE is the break-even volume and RBE the break-even revenue [1], [2]. For a target profit PT, the volume is (F + PT)/CM.
Profit = CM·Q − F MOS = Q − QBE DOL = CM·Q / Profit
Q is the expected sales volume. The margin of safety (MOS) is how far sales can fall before the product loses money, given in units and as a percent of Q. The degree of operating leverage (DOL) is the percent change in profit for a 1 % change in sales [1]. It is shown only when the expected profit is positive. Leave Target Profit at 0 for the plain break-even point, and enter 0 for Expected Sales Volume to skip the forecast rows.
Inputs and limits
- Enter all money values in one currency and for one period, such as a year. The fixed cost and the sales volume must cover the same period.
- The price must be higher than the variable cost, or no volume breaks even.
- The model is linear: price and unit cost stay the same at every volume, and fixed cost does not step up with capacity [3]. Check that the break-even volume is within what the plant can make.
- Volumes come out fractional. Round a break-even volume up to the next whole unit.
- Count only costs that change with volume as variable cost: material, direct labor paid per piece and energy per unit. Rent, salaries and depreciation are fixed.
Worked example
A shop plans to make a pump bracket. Tooling, a machine lease and overhead cost 120,000 a year. Each bracket sells for 85 and costs 52 in material and labor. The owner wants a 30,000 profit and forecasts 6,000 sales a year.
- Enter Total Fixed Cost (F) 120000.
- Enter Selling Price per Unit (p) 85 and Variable Cost per Unit (v) 52.
- Enter Target Profit 30000 and Expected Sales Volume 6000.
- Press Solve. The Solution shows:
Contribution margin per unit: 33
Contribution margin ratio: 38.8235 %
Break-even volume: 3,636.36 units
Break-even revenue: 309,091
Volume for target profit: 4,545.45 units
Profit at expected volume: 78,000
Margin of safety: 2,363.64 units
Margin of safety: 39.3939 %
Degree of operating leverage: 2.53846
Check: 120,000/33 = 3,636.4, so the shop must sell 3,637 brackets to break even. At 6,000 brackets, 33 × 6,000 − 120,000 = 78,000. A DOL of about 2.5 means a 10 % drop in sales cuts profit by about 25 %.