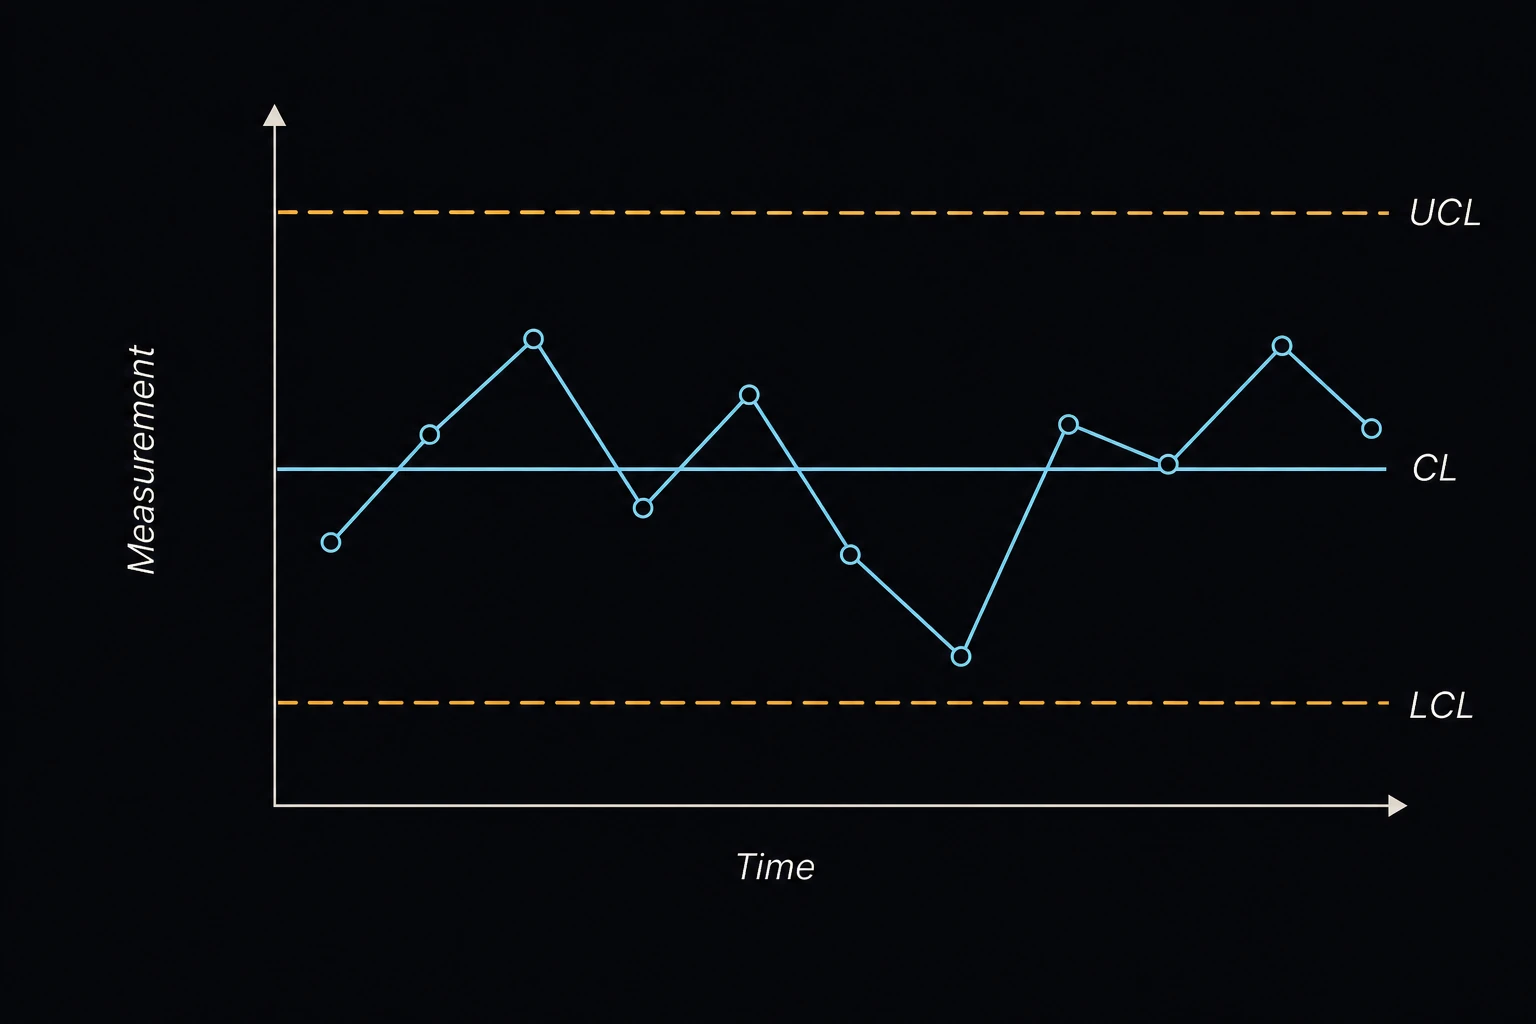
Control Chart Limits
Finds the center line and the upper and lower control limits (UCL, LCL) for the common Shewhart control charts. Pick a variables chart (X̄–R, X̄–S or I–MR) for measurements, or an attributes chart (p, np, c or u) for counts of defectives or defects. Quality engineers and operators use it to set up a chart from a baseline run of data, or to check limits that a software package reports [1]–[3].
Equations
X̄–R: x̄̄ ± A2R̄ R: D3R̄, D4R̄ σ = R̄/d2
X̄–S: x̄̄ ± A3s̄ S: B3s̄, B4s̄ σ = s̄/c4
I–MR: x̄ ± 2.660·M̄R MR: 0, 3.267·M̄R
p: p̄ ± 3√(p̄(1−p̄)/n) np: np̄ ± 3√(np̄(1−p̄))
c: c̄ ± 3√c̄ u: ū ± 3√(ū/n)
x̄̄ is the grand mean of the subgroup means, R̄ the average range, s̄ the average standard deviation and M̄R the average moving range of consecutive readings. n is the subgroup size. p̄ is the average fraction nonconforming, np̄ the average count of nonconforming units per subgroup, c̄ the average defects per inspection unit and ū the average defects per unit. A2, A3, B3, B4, D3, D4, d2 and c4 are the standard Shewhart constants for subgroups of 2 to 10 [1], [2]. A lower limit that would fall below zero is set to zero, and a p-chart UCL is capped at 1.
Limits and common mistakes
- Set limits from 20 to 25 subgroups taken while the process is stable. Drop subgroups with known special causes and recompute.
- Control limits are not specification limits. They show what the process does, not what the drawing allows.
- The p and u limits depend on n. If subgroup sizes vary a lot, work out limits for each size.
- The X̄ charts here take subgroups of 2 to 10. Larger subgroups need constants from a full table [1].
Worked example
An operator measures five pins an hour on a grinder. Over 25 hours the grand mean diameter is 12.004 mm and the average range is 0.021 mm. Set up the X̄–R chart.
- Choose Chart Type X̄–R (mean & range).
- Enter Subgroup Size (n) 5.
- Enter Center Line — grand mean x̄̄ / c̄ / ū 12.004 and Average Range R̄ / Std Dev s̄ / Moving Range M̄R 0.021.
- Press Solve. The Solution shows:
X̄ chart UCL: 12.0161
X̄ chart CL: 12.004
X̄ chart LCL: 11.9919
R chart UCL: 0.044394
R chart CL: 0.021
R chart LCL: 0
Estimated σ = R̄ / d2: 0.00902837
Check: for n = 5, A2 = 0.577, so the limits are 12.004 ± 0.577 × 0.021 = 12.004 ± 0.0121 mm. That is ±3σ/√5 with σ = 0.00903 mm, as it should be.