NPV, IRR & Payback
Tests whether a project earns its keep. From an initial investment and the net cash flows that follow, it gives the net present value at your minimum attractive rate of return (MARR), the benefit–cost ratio, the internal rate of return (IRR) and the simple and discounted payback periods. Engineers use it to justify equipment or an energy upgrade.
The governing equations
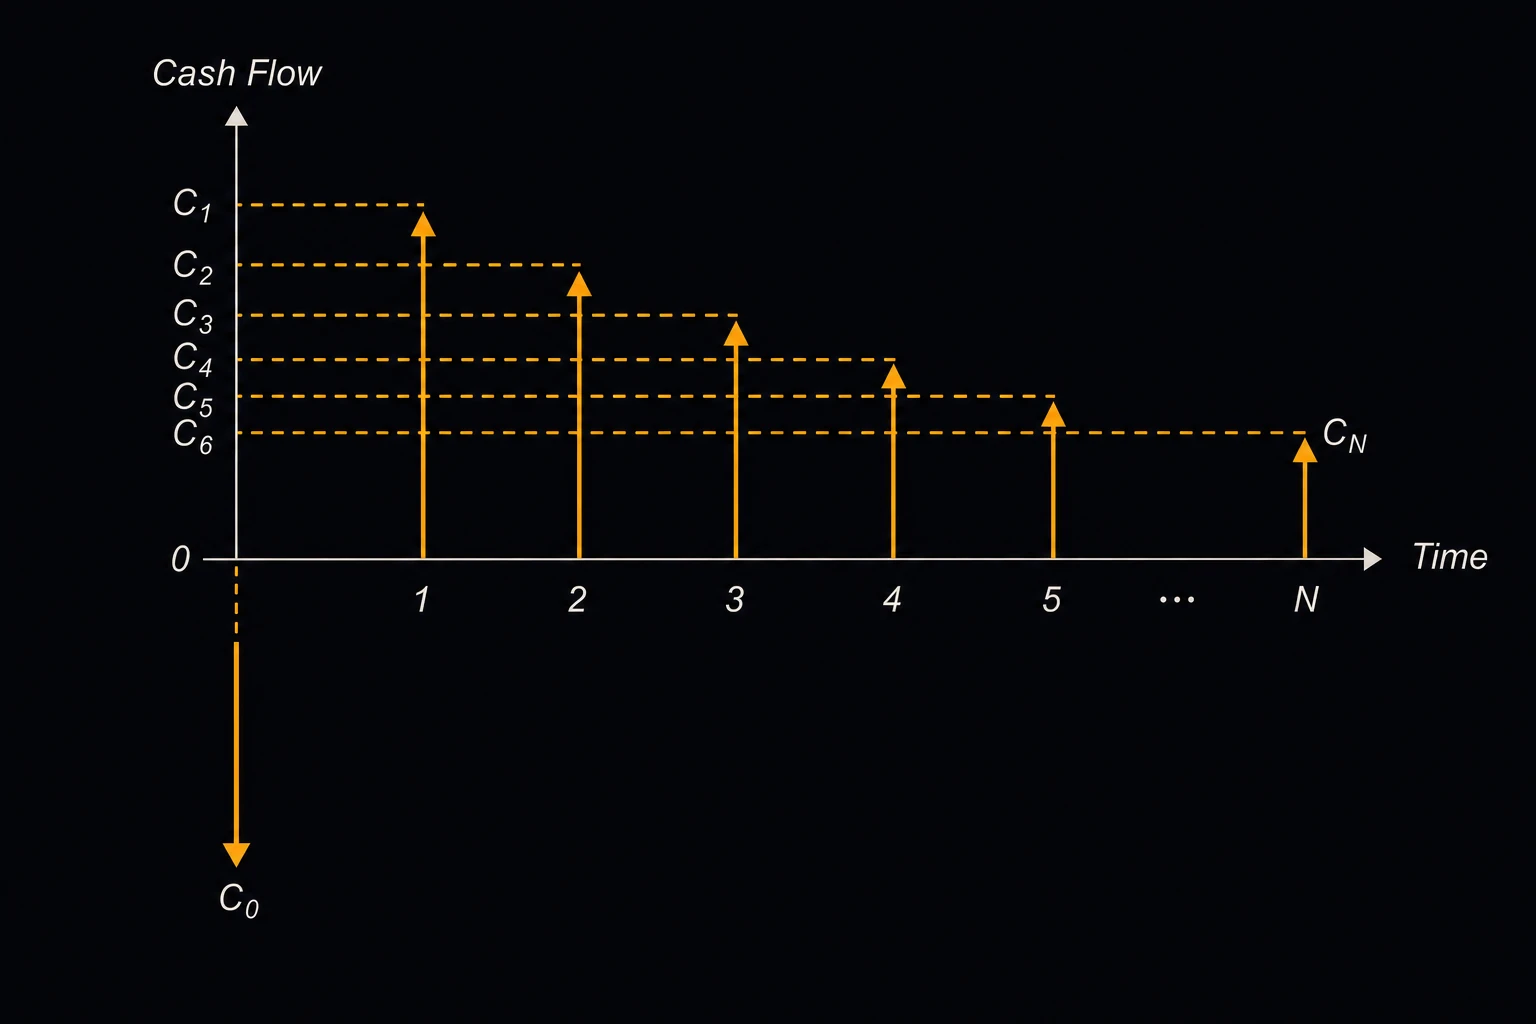
NPV = −I + Σ CFt / (1 + r)t, t = 1 … N
I is the initial investment at time zero, CFt the net cash flow at the end of year t, N the project life in years and r the MARR as a decimal. The salvage value is added to the last year’s cash flow. The project is worth doing at that rate when NPV ≥ 0 [1], [2].
B/C = (NPV + I) / I NPV(IRR) = 0
The benefit–cost ratio B/C is the present value of the inflows per unit of investment, so B/C ≥ 1 matches NPV ≥ 0. The IRR is the rate that makes NPV zero. The page finds it by bisection from −99 % upward and reports it as undefined if NPV never changes sign [1], [3]. The simple payback is the time until the undiscounted flows repay I. The discounted payback uses the flows discounted at the MARR. Both are interpolated within the year the balance turns positive, as if that year’s flow came in evenly.
Inputs and limits
- Enter the investment as a positive number and the yearly flows as net amounts: savings or revenue minus operating cost. A year with a net outflow is negative.
- Choose Uniform for the same flow every year (up to 200 years), or Custom for up to 8 years of individual flows. In Custom, zero years in the middle keep their place, and trailing zeros are dropped.
- The salvage value counts toward both payback periods, since it is part of the last year’s flow.
- A cash-flow series that changes sign more than once can have more than one IRR, and the page returns only one of them. Use NPV to decide in that case.
- Payback ignores everything after the investment is recovered, so use it as a risk screen, not to rank projects.
Worked example
A plant can buy a 180,000 packaging line. It is expected to save 30,000, 50,000, 60,000, 60,000 and 40,000 in years 1 to 5, and to sell for 15,000 at the end. The company’s MARR is 10 %.
- Enter Initial Investment 180000 and choose Cash-Flow Pattern Custom (per-period).
- Enter Year 1 to Year 5 net cash flow 30000, 50000, 60000, 60000 and 40000, and Year 6 to Year 8 0.
- Enter Salvage Value 15000 and MARR / Discount Rate (%) 10.
- Press Solve. The Solution shows:
Sum of undiscounted cash flows: 75,000
Net present value (at MARR): 8,805.41
Benefit–cost ratio (PV inflows / investment): 1.04892
Internal rate of return: 11.7317 %
Simple payback period: 3.66667 yr
Discounted payback period: 4.74216 yr
Decision at this MARR: Accept (NPV ≥ 0)
Check: after 3 years the line has returned 140,000, and the remaining 40,000 is two-thirds of year 4’s 60,000, so the simple payback is 3.67 years. The IRR of 11.7 % is above the 10 % MARR, which agrees with the positive NPV. At a 12 % MARR the same line would be rejected.