Process Capability (Cp, Cpk, Pp, Ppk)
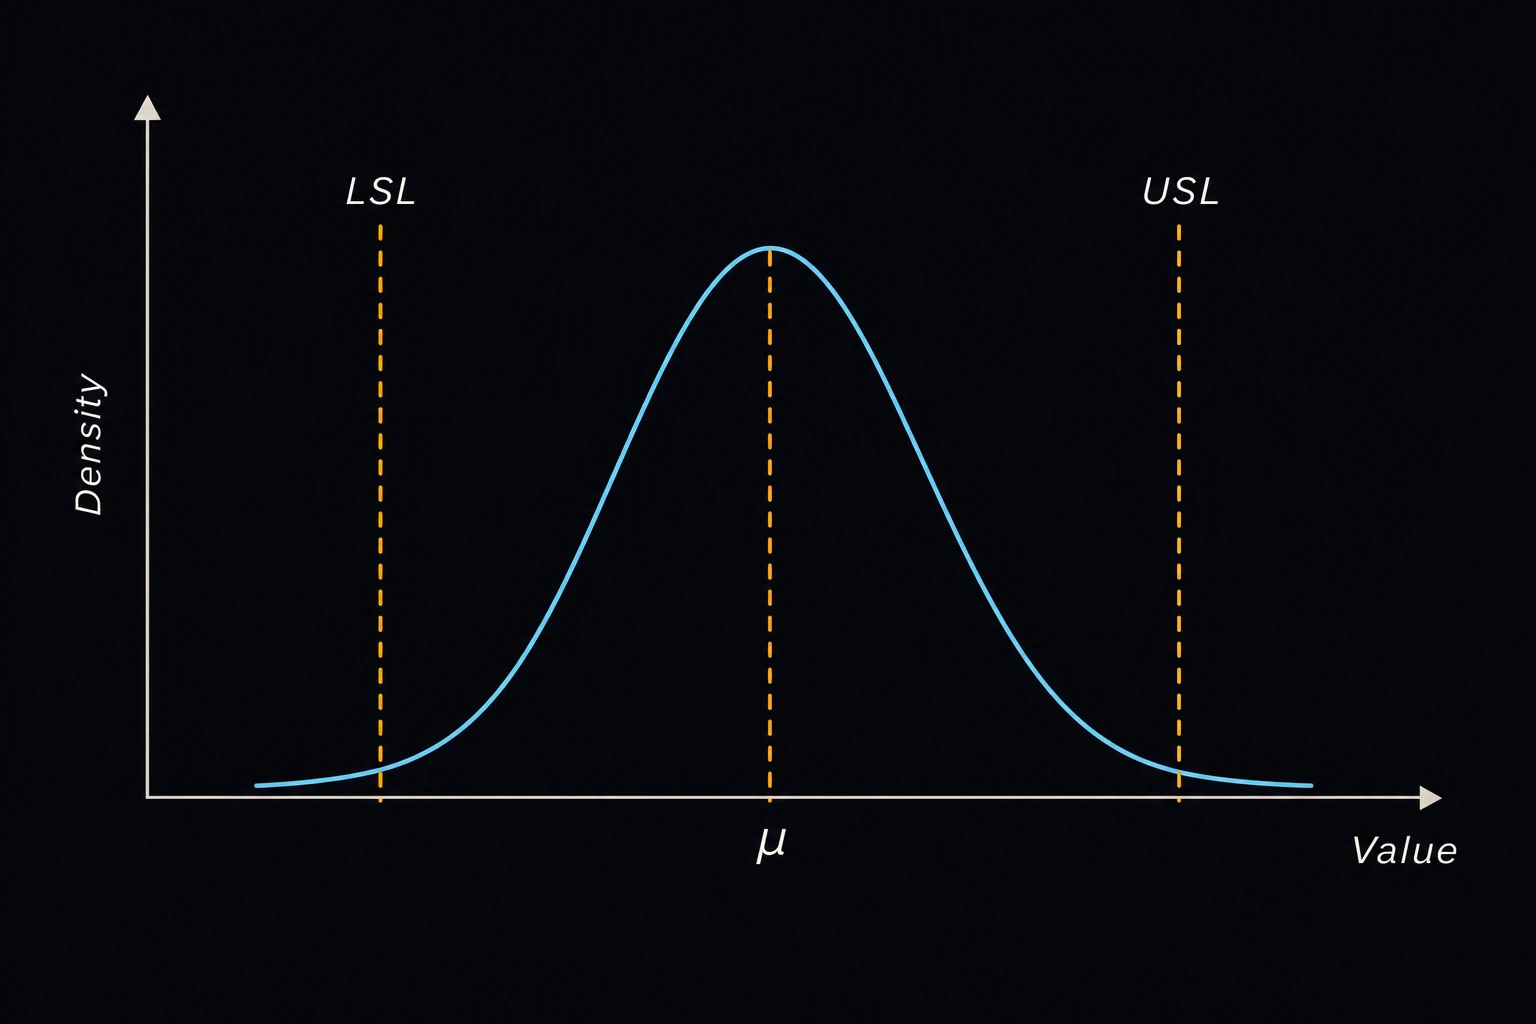
Finds how well a process fits its tolerance: the capability indices Cp and Cpk from the short-term spread, the performance indices Pp and Ppk from the long-term spread, and the expected parts per million (PPM) outside each specification limit. Quality and manufacturing engineers use it for production part approval, supplier qualification and capability studies [2]. The live panel below the Solution draws the process curve against the limits as you type and shades the out-of-spec tails.
Equations
Cp = (USL − LSL) / 6σw
Cpk = min(USL − x̄, x̄ − LSL) / 3σw
Pp = (USL − LSL) / 6σo
Ppk = min(USL − x̄, x̄ − LSL) / 3σo
PPM above = 106·Φ((x̄ − USL)/σo)
PPM below = 106·Φ((LSL − x̄)/σo)
USL and LSL are the upper and lower specification limits and x̄ the process mean, all in the same unit. σw is the within-subgroup standard deviation, usually R̄/d2 or s̄/c4 from a control chart. σo is the overall standard deviation of all the readings; enter 0 to use σw. Φ is the standard normal cumulative distribution [1]. Cp is what the process could do if it were centered; Cpk adds the penalty for being off center. The PPM uses the long-term spread, since that is what the customer receives.
Limits and common mistakes
- The indices mean something only for a stable process. Check the control chart first.
- The PPM assumes a normal distribution. Skewed data, such as flatness or runout, need a fitted distribution or a transformation.
- Don’t put the overall standard deviation in the within field. Cpk then equals Ppk and the short-term figure looks worse than it is.
- Many customers require Cpk ≥ 1.33 for an ongoing process and more for a new or safety-critical one. A small sample gives a wide confidence band on any index.
- The live panel uses σw, so its curve and its Cp and Cpk are short-term values.
Worked example
A turned shaft diameter is toleranced 25.00 ± 0.05 mm. A capability study gives a mean of 25.012 mm, a within-subgroup standard deviation of 0.011 mm and an overall one of 0.014 mm. Does it meet Cpk 1.33, and how many parts will be out?
- Enter Upper Specification Limit (USL) 25.05 and Lower Specification Limit (LSL) 24.95.
- Enter Process Mean (x̄) 25.012.
- Enter Within-Subgroup Std Dev 0.011 and Overall Std Dev 0.014.
- Press Solve. The Solution shows:
Cp (potential, within): 1.51515
Cpk (actual, within): 1.15152
Pp (overall): 1.19048
Ppk (overall): 0.904762
Expected PPM above USL: 3,320.94 ppm
Expected PPM below LSL: 4.74297 ppm
Expected total PPM out of spec: 3,325.69 ppm
Check: the mean sits 0.038 mm below the USL, and 0.038 / (3 × 0.011) = 1.15. The spread is good enough (Cp 1.52), but the process runs high. Centering it at 25.000 mm would raise Cpk to Cp, above 1.33.