Queuing Models (M/M/1, M/M/c, M/M/1/K, M/G/1)
Gives the steady-state results for five classic queuing models: utilization, the mean number waiting and in the system, and the mean wait and time in the system. Industrial engineers and operations analysts use it to size service counters, tool cribs, repair crews and dock doors. The Live Wait Time vs. Utilization chart shows how the wait climbs as the load rises.
The models
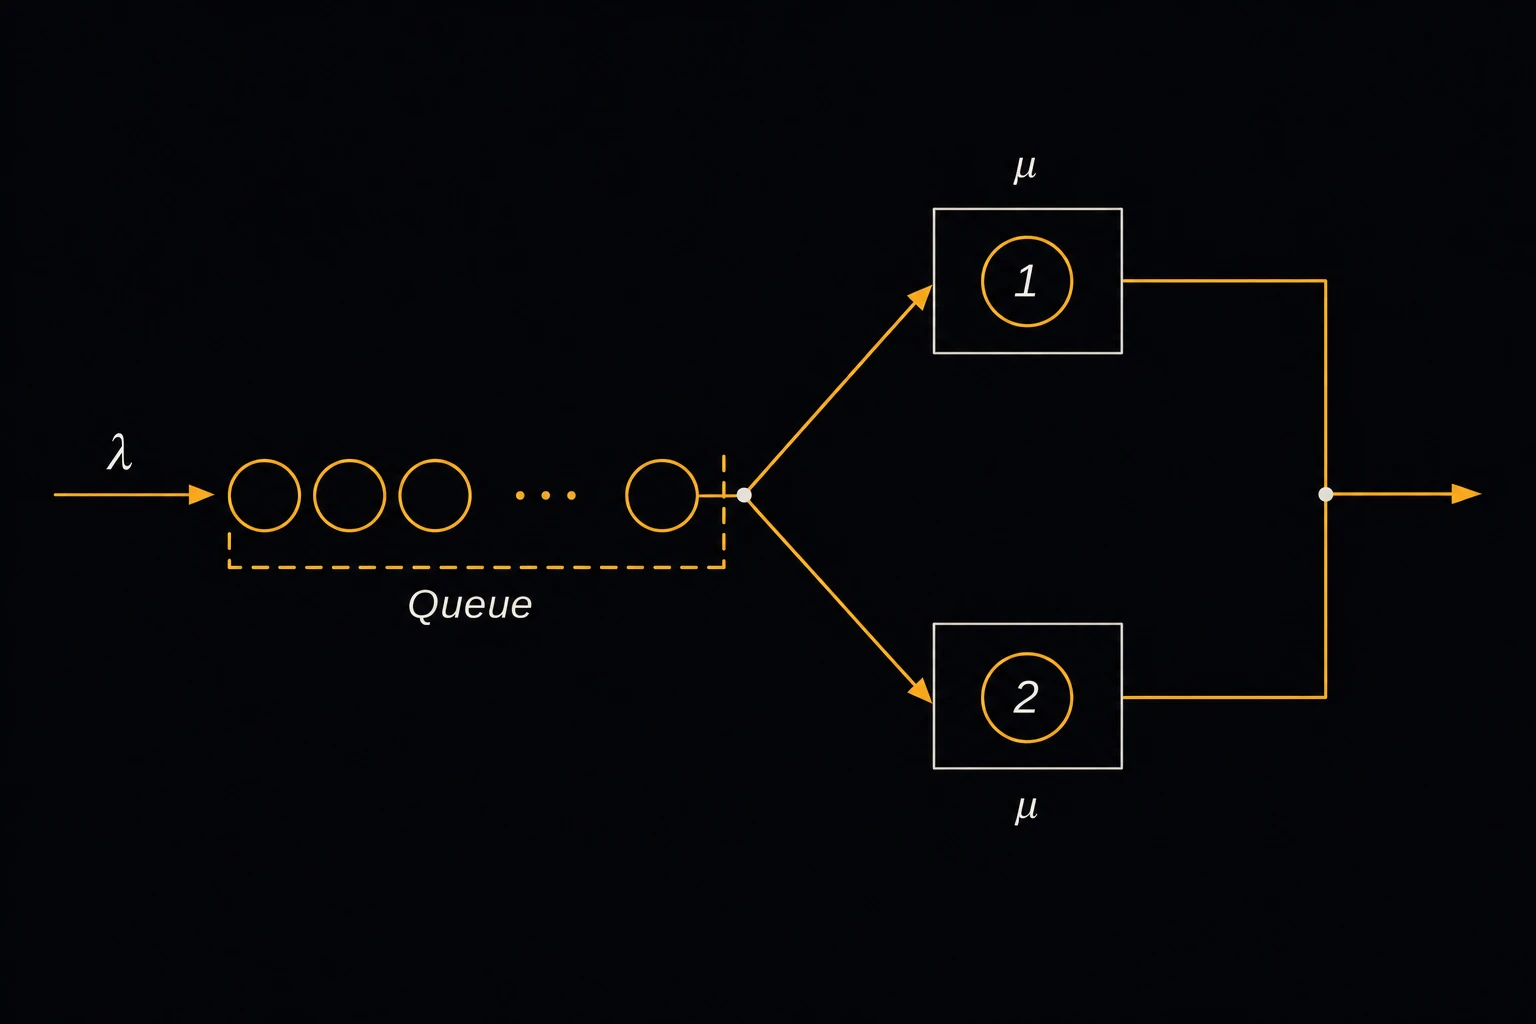
In the Kendall notation, M means random (Poisson) arrivals or exponential service times, G a general service-time distribution and D a fixed service time. The digit or c is the number of servers, and K a limit on the number in the system [1], [2]. λ is the arrival rate and μ the service rate of one server, both per hour. The utilization is ρ = λ/(cμ).
M/G/1: Lq = ρ²(1 + Cs²) / (2(1 − ρ))
This is the Pollaczek–Khinchine formula [3]. Cs is the coefficient of variation of the service time (standard deviation over mean). M/M/1 is the case Cs = 1, so Lq = ρ²/(1 − ρ). M/D/1 is Cs = 0, half the M/M/1 queue.
M/M/c: Lq = Pw·ρ / (1 − ρ)
Pw is the Erlang C probability that an arrival finds all c servers busy, and a = λ/μ the offered load in erlangs [1]. For M/M/1/K, arrivals that find K customers in the system are turned away. PK is that blocking probability and λeff = λ(1 − PK) the rate actually served. With a finite K, ρ may exceed 1 [2].
Wq = Lq / λ W = Wq + 1/μ L = λ·W
These follow from Little’s Law, with λeff in place of λ for M/M/1/K. The page shows the times in minutes.
Limits and common mistakes
- μ is the rate of one server, not of the whole system. A clerk who takes 6 minutes per job has μ = 10 an hour.
- The results are long-run averages. Without a capacity limit they need ρ < 1, and the page returns an error at or above it.
- Real arrivals are often less random than Poisson. For a production workstation with known variability, use the Workstation Queue Time calculator.
Worked example
A tool crib has three attendants. Mechanics arrive at random, about 24 an hour, and an attendant takes 6 minutes on average to serve one. How long does a mechanic wait?
- Choose Model M/M/c.
- Enter Arrival Rate (λ, per hour) 24 and Service Rate per Server (μ, per hour) 10.
- Enter Number of Servers (c) 3.
- Press Solve. The Solution shows:
Offered load a = λ/μ (Erlangs): 2.4
Utilization per server ρ: 0.8
P0 (system empty): 0.0561798
Probability an arrival must wait (Erlang C): 0.647191
Lq / L: 2.58876
L (mean number in system): 4.98876
Wq (mean wait in queue): 6.47191 min
W (mean time in system): 12.4719 min
Check: L = Lq + a = 2.589 + 2.4 = 4.989, and Wq = 2.589 / 24 per hour = 0.1079 h = 6.47 min. A fourth attendant would cut the wait to about a minute.